
Story map
- 01The Quarter That Shifted the Narrative
- 02Construction as the Engine—and the Fuel Behind It
- 03Services Quietly Compounding Alongside Industry
- 04The CSE Names Sitting Closest to the Boom
- 05Margin Math Meets Execution Risk
- 06What the Market Is Already Pricing—and What It Is Not
- 07The Conditional Path Ahead
By mid-June the Colombo trading floor had already priced a better-than-expected first-quarter print, yet the official release still landed with force. Sri Lanka’s real GDP rose 5.1 percent year-on-year in the three months to March 2026, the Department of Census and Statistics confirmed, lifting the economy past the 4.7 percent pace of the prior quarter.
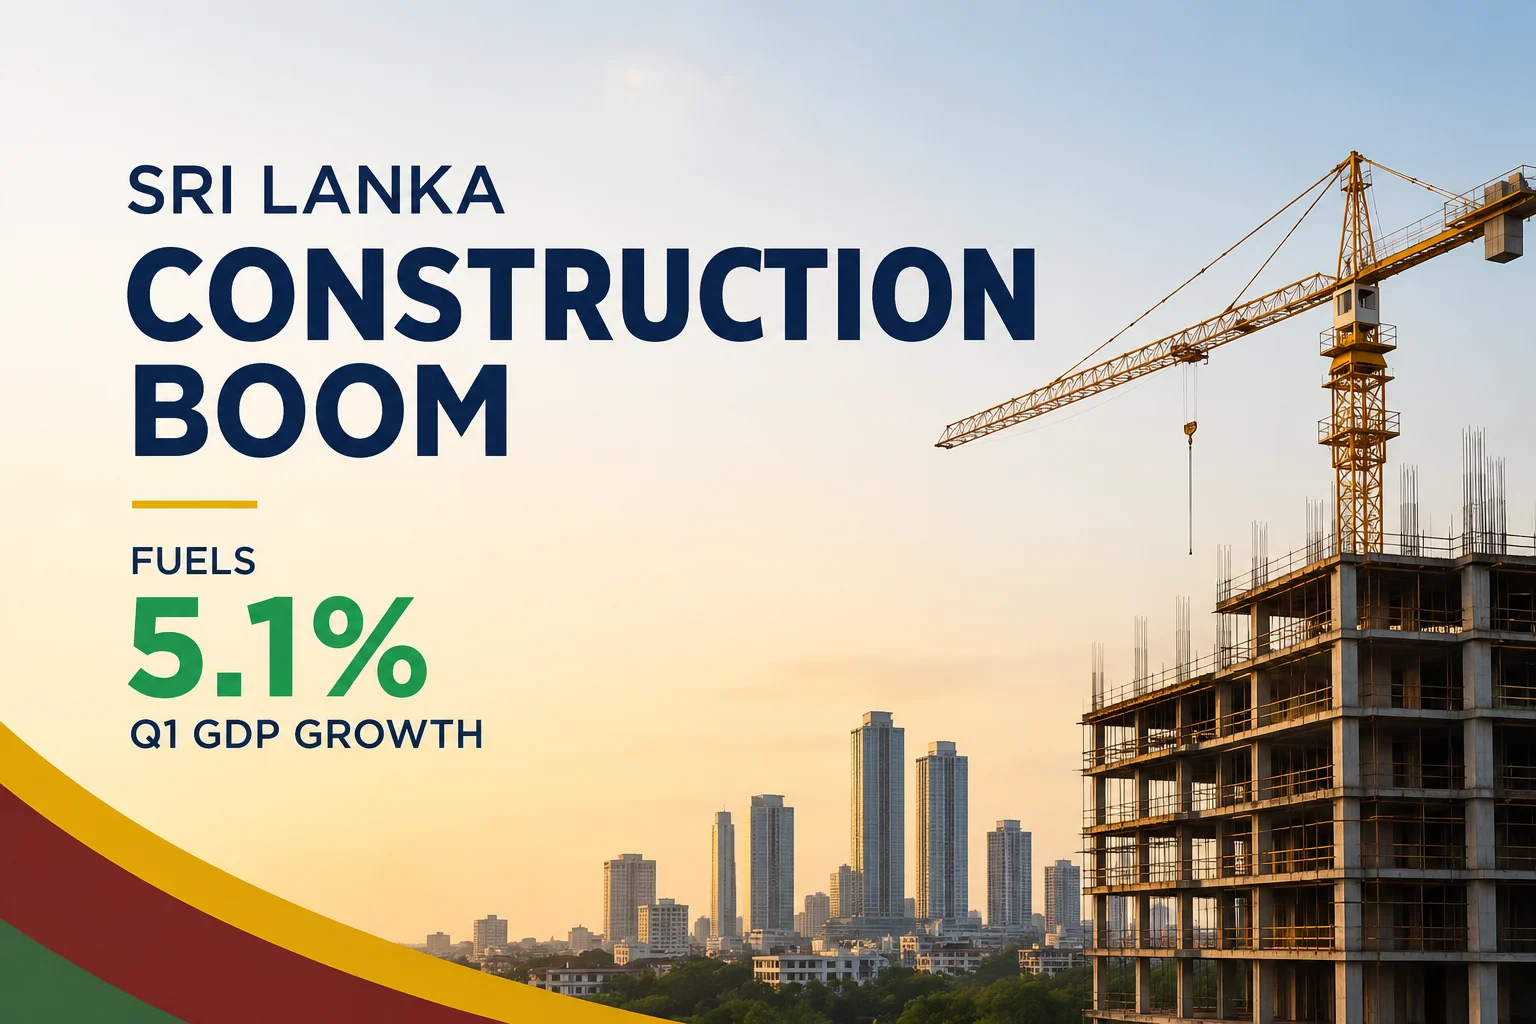
That single number reframes the conversation. What began as a fragile post-crisis rebound has sharpened into a sector-specific surge, led by a 16.3 percent leap in construction and a 19.5 percent jump in mining and quarrying. For investors scanning the CSE, the pivot from broad recovery to concentrated industrial momentum is the story that matters now.
Start here
The short version
- 01Sri Lanka’s economy expanded 5.1 percent in real terms in the first quarter of 2026, with the industrial sector as the clear engine. Construction rose 16.3 percent and mining 19.5 percent, while financial services and IT programming posted double-digit gains. The shift from broad
- 02The first three months of 2026 arrived with low expectations.
- 03Construction’s 16.3 percent leap did not appear from thin air.
Method, source and disclosure
This analysis is prepared by the Market Lens desk from the sources named in the story and publicly available market information. Material revisions appear in the updated timestamp.
View primary source ↗The Quarter That Shifted the Narrative
The first three months of 2026 arrived with low expectations. Fuel rationing had returned in March, public holidays on Wednesdays trimmed working days, and energy prices were already climbing on global tensions. Against that backdrop the 5.1 percent real GDP print, measured at constant 2015 prices, felt almost defiant.
Constant-price GDP reached LKR 3,653 billion, up from LKR 3,477 billion a year earlier. Industry expanded 7.2 percent and accounted for more than a quarter of total output. Within that bucket the standout numbers were unmistakable: construction advanced 16.3 percent, mining and quarrying 19.5 percent, while manufacturing managed a more modest 2.8 percent.
Services, still the largest slice of the economy, grew 3.4 percent. Insurance activities surged 22 percent, IT programming and consultancy 16.1 percent, and financial services 12.8 percent. Agriculture, long a drag, finally turned positive at 1.1 percent, helped by a 64.8 percent jump in coconut output that offset weaker paddy and tea.
These are not abstract percentage points. They mark the moment the recovery narrative stopped being about “returning to pre-crisis levels” and started being about which sectors can keep compounding. For equity investors the distinction is material: broad beta is less interesting than pure-play exposure to the industrial acceleration.
Context
Construction as the Engine—and the Fuel Behind It
Construction’s 16.3 percent leap did not appear from thin air. Three forces converged. First, the 2026 national budget allocated roughly LKR 1.4 trillion to capital expenditure—transport corridors, housing schemes, irrigation works and urban regeneration. After years of under-execution under fiscal consolidation, project pipelines began to move again.
Second, post-disaster reconstruction added non-discretionary demand. The cyclone that struck late 2025 damaged more than 100,000 housing units and left roads, bridges and power infrastructure in need of urgent repair. Government grants and multilateral funding created a multi-quarter order book that private contractors and materials suppliers could bank on.
Third, monetary conditions in the first quarter remained supportive. The average weighted prime lending rate sat near 9.3 percent earlier in the year, low enough to reawaken housing-loan disbursements and small-scale private projects. High-frequency indicators captured the turn: the Construction PMI climbed above 70 in early 2026, the highest readings on record, with new orders and employment expanding in tandem.
Capacity utilisation across cement plants still hovered around 50 percent, meaning volume growth can translate quickly into operating leverage. That dynamic explains why the industrial print outpaced the overall economy and why materials producers suddenly look more interesting than they have in years.
Market data
Services Quietly Compounding Alongside Industry
While construction seized the headlines, services delivered steady, high-quality growth. Financial services expanded 12.8 percent, a direct reflection of the lower-rate environment that prevailed through most of the first quarter. Loan books began to expand again, fee income recovered, and insurance premium growth accelerated as both corporates and households rebuilt cover after years of under-insurance.
IT programming and consultancy jumped 16.1 percent. The sector has long been one of Sri Lanka’s more resilient export earners; the latest print suggests that global demand for near-shore development and business-process work remains intact even as domestic recovery gathers pace. Together these two sub-sectors added breadth that pure industrial plays lack.
The combination matters for portfolio construction. Construction and materials names offer cyclical torque; banks, finance companies and selected IT counters offer more defensive compounding. In a market still digesting rate volatility later in the year, that dual exposure becomes a practical way to participate without betting the entire book on public-works execution.
What it means
The CSE Names Sitting Closest to the Boom
Not every listed company will capture the industrial resurgence equally. The clearest beneficiaries sit inside the construction and materials value chain.
Access Engineering PLC remains the purest large-cap proxy. Its civil-engineering franchise is deeply embedded in expressway packages, airport expansions and urban infrastructure. The company also owns a significant asphalt franchise and a growing property-development arm, giving it both order-book visibility and some insulation from pure contracting margins. When public capital spending accelerates, Access Engineering’s pipeline tends to lengthen first.
Tokyo Cement Company (Lanka) PLC is the volume play. With industry capacity utilisation still low, every additional tonne of cement sold carries high incremental margin. The company has also expanded into ready-mix concrete and dry mortar—higher-value products that smooth earnings and deepen its footprint across the construction cycle. Biomass energy and vertical integration further protect costs when global energy prices spike.
Royal Ceramics Lanka PLC and Lanka Tiles PLC dominate the tile and bathware segment. Both brands rebuilt market share during the import-restriction years and now possess modern capacity that can ramp without heavy new capital. Residential and commercial finishing work typically lags the initial civil works by several quarters, so these names often deliver a second-wave earnings response once foundations are poured.
Sierra Cables PLC supplies the electrical backbone. Housing, commercial buildings and infrastructure projects all require copper and aluminium cables. Utilisation at Sierra has already approached full capacity on the back of export orders and domestic recovery; further construction growth translates almost directly into higher throughput.
JAT Holdings, while more diversified, benefits from coatings and finishes demand that travels with the same building cycle. Together these five names form a concentrated basket that tracks the industrial print more closely than the broader ASPI.
Comparison
Margin Math Meets Execution Risk
Volume is only half the story. The other half is whether rising activity can expand margins after years of cost shocks. Cement producers still face imported clinker and energy bills that move with global oil. Tile makers confront LPG and electricity tariffs. Contractors must manage steel, bitumen and skilled-labour inflation.
The first-quarter data suggest operating leverage is beginning to appear. Construction’s 16.3 percent real growth arrived while overall manufacturing stayed muted at 2.8 percent, implying that the materials and civil-works sub-sectors are running ahead of general industry. Broker research published in March already flagged Access Engineering and Tokyo Cement as the clearest beneficiaries of that differential, citing project pipelines and capacity headroom.
Yet execution remains the binding constraint. Large expressway and airport packages still depend on timely financing closures and multilateral disbursements. Any slip in budgeted capital spending—or a renewed surge in energy prices—can compress the very margins the volume recovery is supposed to expand. The rate hike delivered by the Central Bank in late May, lifting the overnight policy rate to 8.75 percent, is an early reminder that the “lower-rate environment” of Q1 is no longer guaranteed.
What comes next
What the Market Is Already Pricing—and What It Is Not
By early July the ASPI had already reflected a portion of the better growth story. Construction and engineering counters outperformed the broader index in the weeks after the GDP release, yet valuations remain far from stretched by historical standards. Many of these stocks still trade at discounts to their mid-cycle multiples, reflecting residual scepticism about the durability of public-works spending and the risk of another external shock.
That scepticism is not irrational. Fuel rationing and Wednesday holidays reappeared in March precisely because the external account remains sensitive to oil prices. Remittances and tourism receipts are resilient but not infinite. If global energy markets stay elevated, the Central Bank will have limited room to reverse the May rate increase, and private housing demand—the quieter engine of tile and cable volumes—could cool.
At the same time the order books already secured for 2026 and into 2027 give the listed names a degree of earnings visibility that pure cyclical stocks often lack. Investors who treat the sector as a pure trade on the next GDP print may therefore miss the multi-quarter nature of the reconstruction and infrastructure wave now under way.
What comes next
The Conditional Path Ahead
If government capital expenditure continues to execute near the LKR 1.4 trillion budgeted level, if post-cyclone reconstruction stays funded, and if energy-cost pressures moderate, the industrial complex that powered the first-quarter print can remain the economy’s growth engine through 2026. In that scenario construction and materials names on the CSE retain the clearest fundamental tailwind.
If, however, financing bottlenecks re-emerge or another external shock forces further monetary tightening, the same companies will face margin compression and slower order conversion. The 5.1 percent number itself is already history. What matters now is whether the forces that produced it—public works, reconstruction demand and still-supportive credit conditions—can outlast the headwinds that appeared later in the year.
For stock-market participants the practical implication is straightforward: the Sri Lanka construction boom is no longer a narrative of recovery. It is a narrative of selective, sector-specific growth. The companies closest to the cement trucks, the expressway packages and the finishing trades will determine whether that growth reaches earnings, and ultimately valuations, on the Colombo board.