Technical analysis equips traders with tools to interpret price action and volume. Patterns like head and shoulders or moving average crossovers promise predictive power. However, real markets frequently invalidate these signals when human elements intervene.
Traders who depend solely on charts risk missing the bigger picture. Events driven by collective behavior or sudden announcements can render technical setups obsolete in hours. Two landmark cases drive this point home.
Here is the kicker. Crowd dynamics and structural imbalances have repeatedly trumped even the clearest chart formations.
Start here
The short version
- 01Technical analysis spots patterns in price and volume that many traders use daily. Yet major events prove it cannot be relied on exclusively when external forces dominate. The 2021 GameStop frenzy and 2008 Volkswagen squeeze show how crowd behavior and structural surprises render
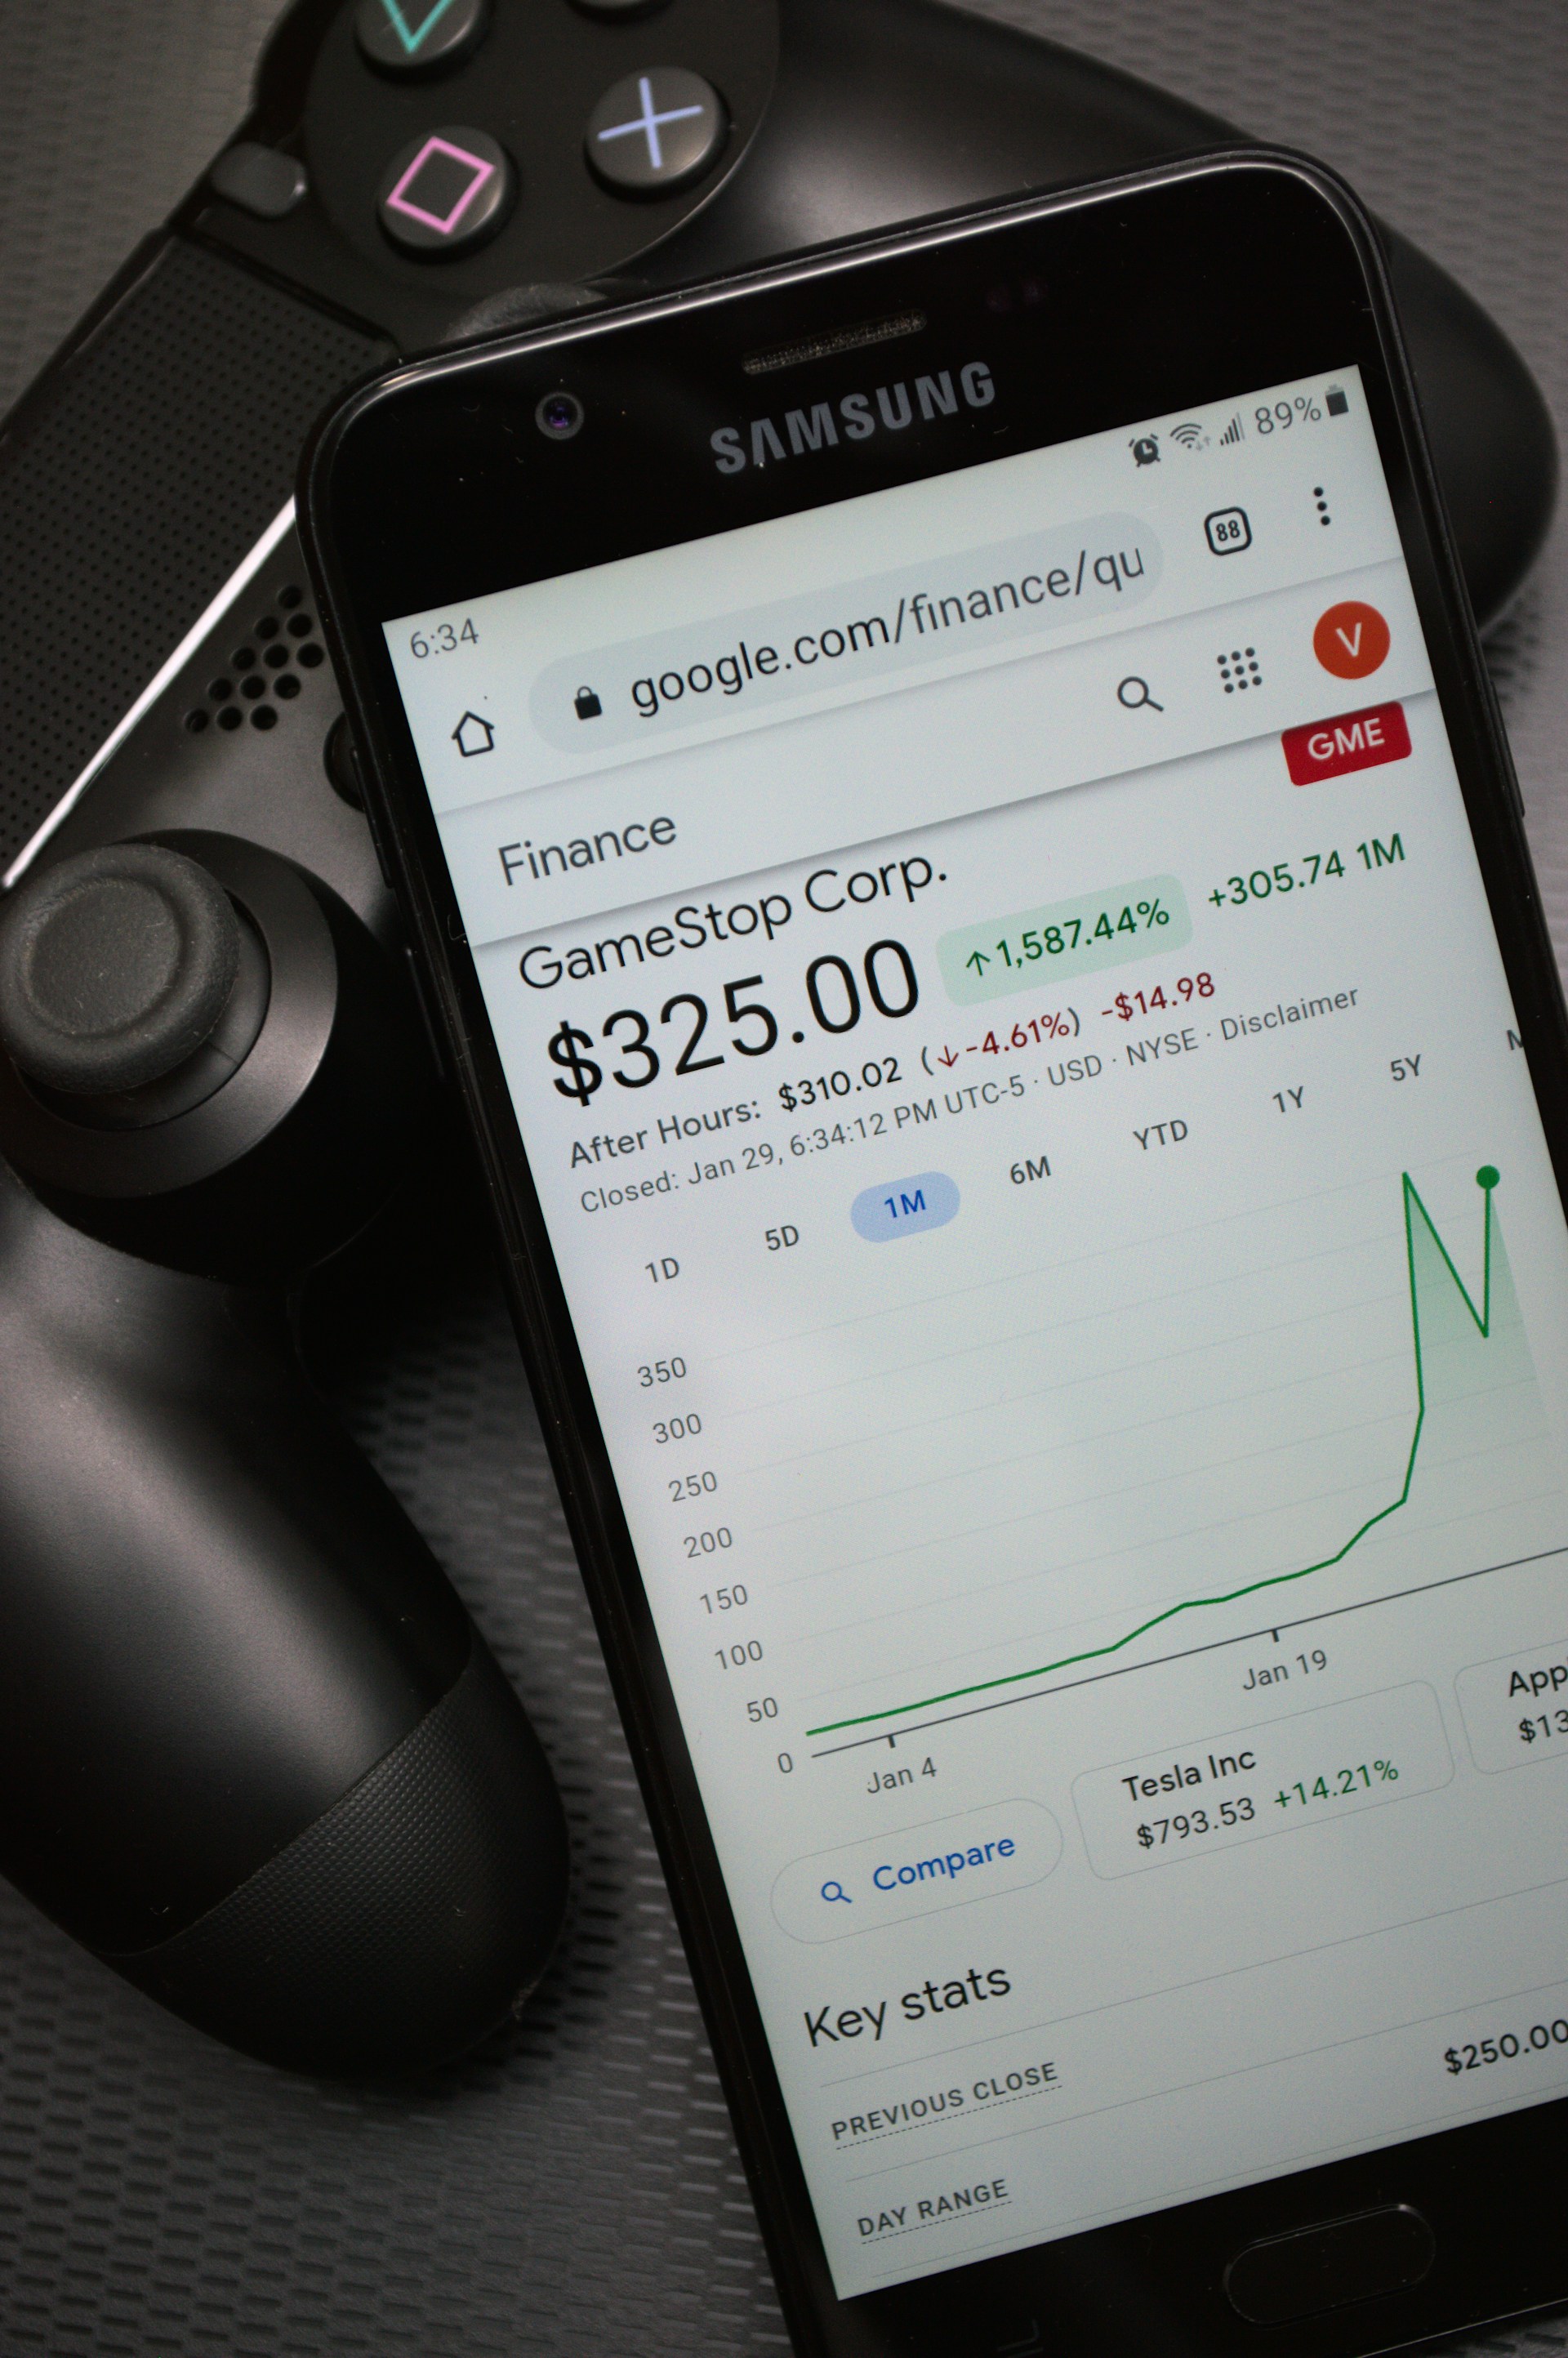
- 02By January 2021, GameStop carried short interest over 140 percent of its float.
- 03In late October 2008, amid the global financial crisis, Porsche revealed a dominant stake in Volkswagen via derivatives.
Method, source and disclosure
This analysis is prepared by the Market Lens desk from the sources named in the story and publicly available market information. Material revisions appear in the updated timestamp.
View primary source ↗The GameStop Saga
By January 2021, GameStop carried short interest over 140 percent of its float. Hedge funds anticipated further declines for the brick-and-mortar retailer. Technical indicators flagged extreme conditions as the price began its ascent from around $20.
What changed next was retail coordination on social media. WallStreetBets users bought shares en masse, triggering forced covering by shorts. The price exploded past $483 at peak, defying every resistance level and overbought reading.
Standard technical analysis would have prompted exits long before the peak. Yet the move was fueled by sentiment and mechanics, not company performance. A Cato Institute review later highlighted how this coordination suspended normal market discipline.
Volkswagen's 2008 Short Squeeze
In late October 2008, amid the global financial crisis, Porsche revealed a dominant stake in Volkswagen via derivatives. Free float dropped sharply, catching short sellers off guard. The stock jumped from roughly €210 to over €1,000 within two days.
Charts at the time reflected a battered auto sector in free fall. Bearish patterns dominated. Short positions, built on fundamental weakness, faced massive losses estimated at tens of billions as covering became nearly impossible.
Why this matters is simple. Low liquidity and surprise corporate moves exposed the fragility of relying on past price behavior alone. Contemporary reports confirm Volkswagen briefly became the world's most valuable listed company.
The Limits of Technical Analysis
Similar breakdowns occur during black swan events. The May 6, 2010 Flash Crash saw the Dow Jones drop almost 1,000 points in minutes before rebounding. No technical pattern foreshadowed the plunge, as documented in the joint SEC-CFTC report.
Today, social media amplifies volatility beyond historical norms. Fundamentals or policy shifts can gap prices instantly. Over-reliance on indicators ignores these realities and heightens risk.
Key Reasons Charts Can Mislead
- Coordinated retail actions override patterns
- Corporate announcements shrink available shares
- Extreme events erase prior technical context
- Psychological factors trump data-driven signals
Technical analysis still offers value in trending, orderly markets. It promotes discipline and visual clarity when paired with other inputs. Acknowledging its limits prevents costly surprises.
Markets reward those who adapt. Blending chart insights with awareness of sentiment and news builds resilience. In the end, no single method guarantees success when conditions shift unexpectedly.