Story map
- 01The Visual Language of the CSE Heatmap
- 02Linking Heatmap Signals to Institutional Block Trades
- 03Reading Level 2 Data on the CSE Trading Platform
- 04Identifying Artificial Sell-Walls in the Order Book
- 05Practical Integration: Heatmap Plus Level 2 Workflow
- 06Common Pitfalls and Refinements
- 07What Would Invalidate the Current Read
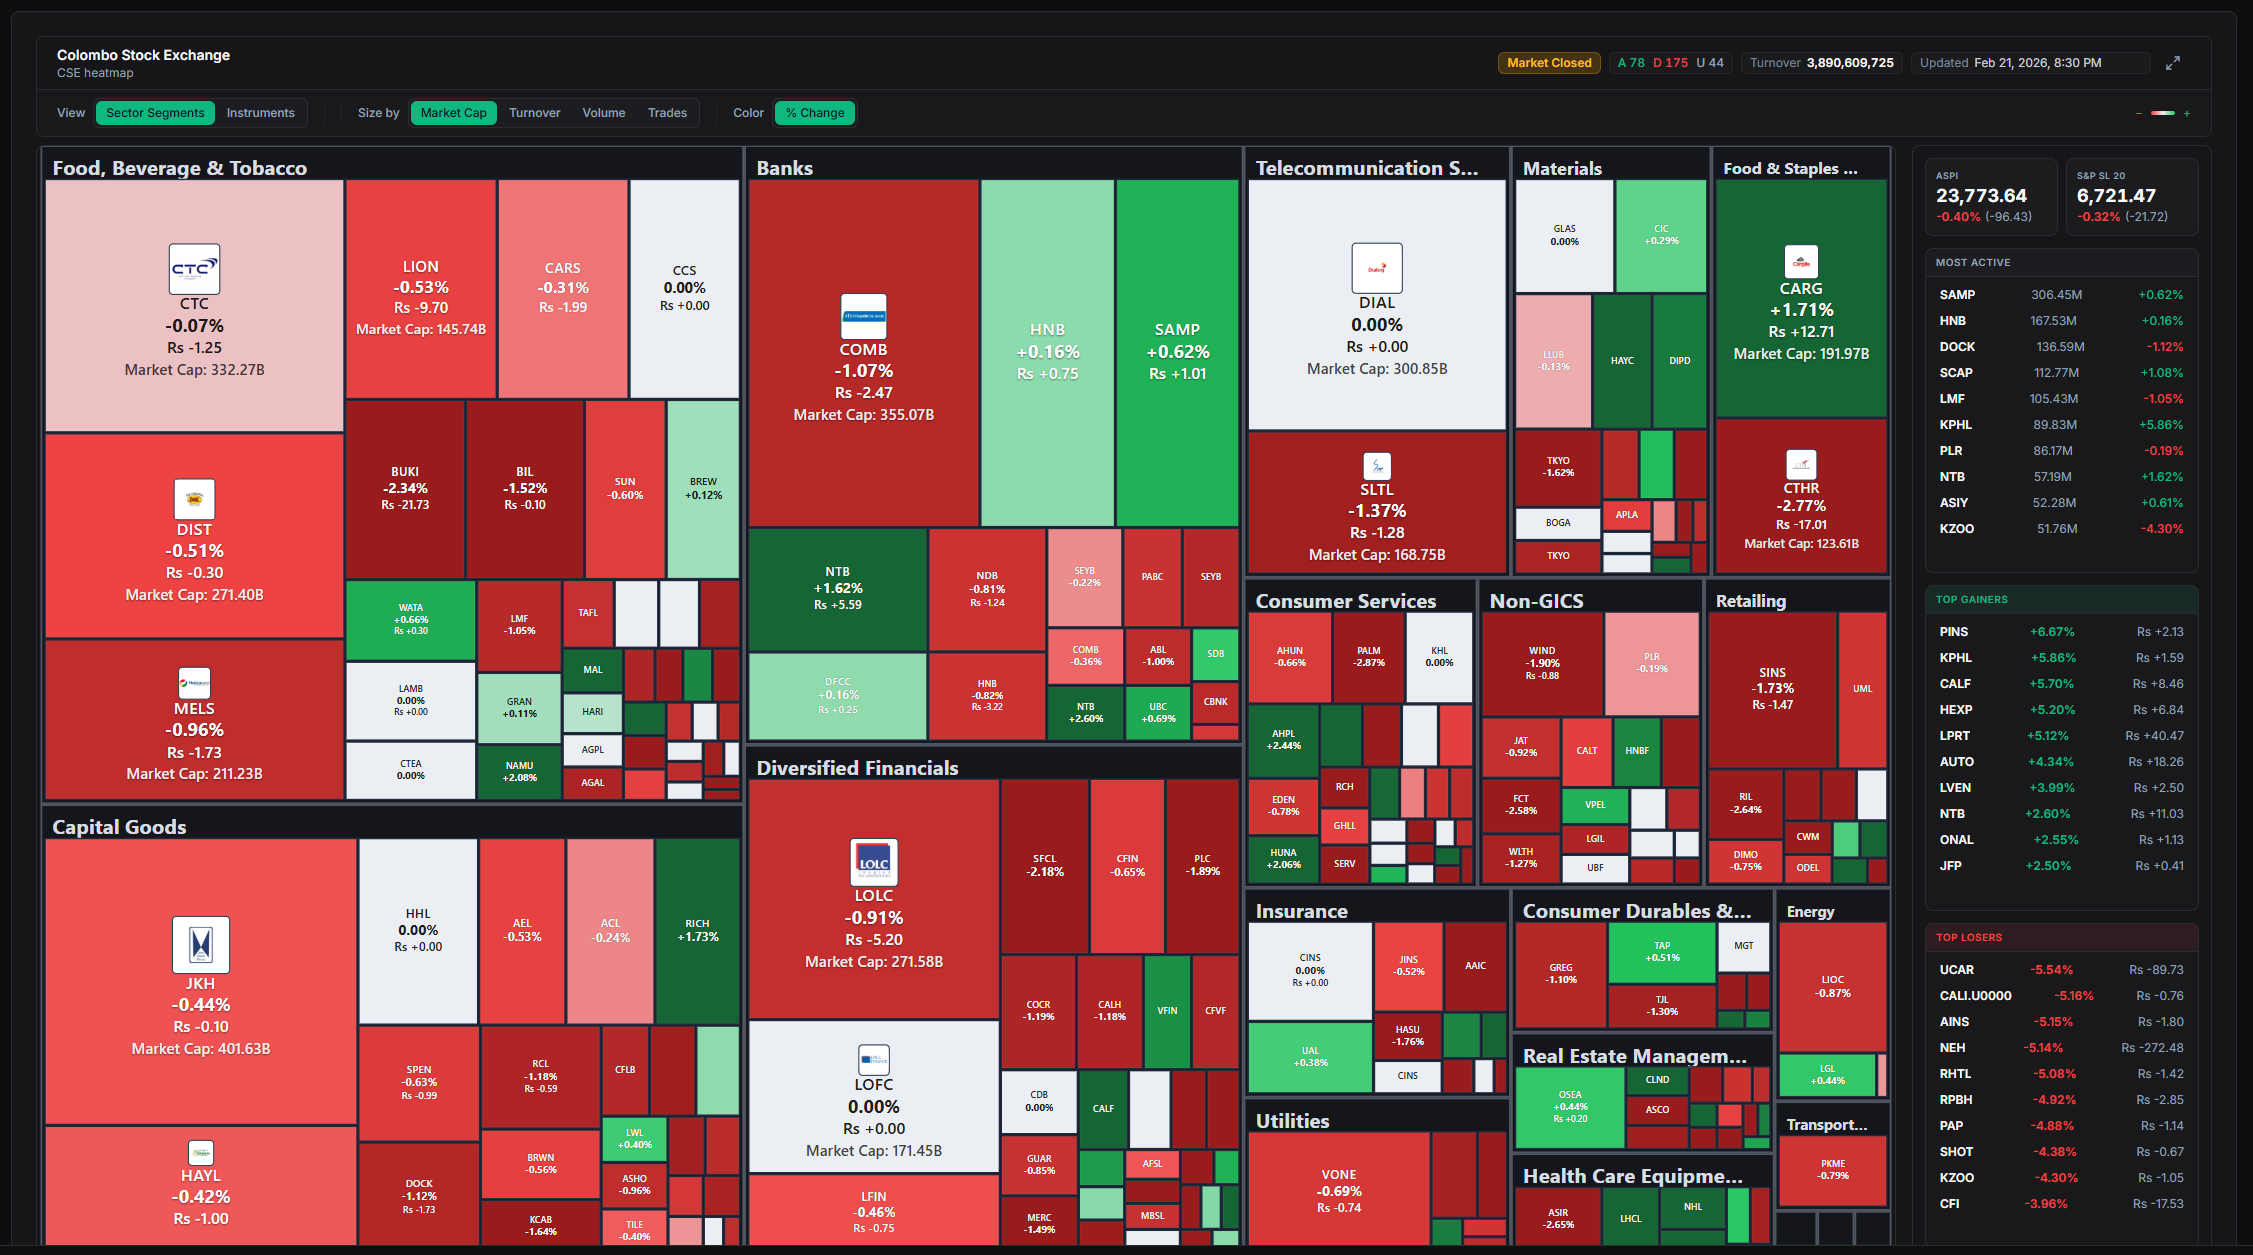
On a typical trading morning in Colombo, the All Share Price Index edged higher by 1.06% as of mid-session on April 16, 2026, with broad participation across sectors. Yet beneath the surface numbers, something more telling unfolded across individual counters. Large blocks of shares changed hands quietly while smaller participants reacted to visible price ticks.
The TaprobaneFi CSE Heatmap captured these shifts in vivid color gradients. Green clusters signaled building buying interest while isolated red patches hinted at distribution pressure. For retail investors without direct lines to institutional desks, this visual layer offers a practical window into real-time accumulation patterns.
This article traces how the heatmap, combined with Level 2 order book data available through CSE trading platforms, helps identify institutional footprints. It also covers techniques for spotting artificial sell-walls that can distort short-term price action.
Start here
The short version
- 01The TaprobaneFi CSE heatmap translates raw order flow into visual signals of accumulation and distribution. By pairing it with Level 2 depth and spotting artificial sell-walls, retail investors gain an edge in anticipating institutional block trades without direct access to propr
- 02Heatmaps transform complex market data into an intuitive grid.
- 03Institutional players on the Colombo Stock Exchange often execute sizable positions through block trades or crossings.
Method, source and disclosure
This analysis is prepared by the Market Lens desk from the sources named in the story and publicly available market information. Material revisions appear in the updated timestamp.
The Visual Language of the CSE Heatmap
Heatmaps transform complex market data into an intuitive grid. Each tile represents a listed security, sized or colored according to metrics such as percentage price change, trading volume relative to average, or market capitalization weight. On the TaprobaneFi version, color intensity reflects the strength of movement while hover details reveal supporting figures.
Watch for sustained green expansion across a sector cluster. This often coincides with periods when institutional accounts add positions incrementally rather than through single large prints that might alert the broader market. Conversely, abrupt red flares in otherwise stable names can flag early distribution phases.
The tool updates dynamically during CSE trading hours from 9:30 a.m. to 2:30 p.m. local time. Retail users refresh or leave the page open to monitor shifts in real time. Unlike delayed price tickers, the heatmap emphasizes relative strength, helping isolate stocks attracting disproportionate attention on any given session.
Early in a session, focus on the top gainers and losers panels. Persistent presence of a mid-cap name in the green zone, accompanied by elevated volume, frequently precedes larger block activity later in the day or across subsequent sessions.
Linking Heatmap Signals to Institutional Block Trades
Institutional players on the Colombo Stock Exchange often execute sizable positions through block trades or crossings. These large negotiated transfers minimize market impact but leave traces in volume profiles and subsequent price behavior.
Retail investors can use the CSE Heatmap to position ahead of such moves by tracking precursors. A stock showing gradual color deepening toward stronger green shades, coupled with steady volume buildup, may indicate quiet accumulation. When block trades eventually print—sometimes visible as spikes in daily turnover—the price reaction tends to be muted if buyers have already absorbed selling pressure.
Consider a scenario where a banking sector name holds steady in the heatmap's moderate green band for several consecutive days. Volume remains above the 30-day average without dramatic price jumps. This setup frequently aligns with institutional buyers building stakes ahead of anticipated earnings or sector catalysts. Retail participants monitoring the heatmap can scale into smaller positions gradually rather than chasing post-block momentum.
The reverse pattern holds for distribution. Sudden red intensification without fundamental news often signals institutions lightening holdings through off-market blocks. Price may hold initially due to retail buying, but subsequent sessions reveal the underlying supply once the large seller has exited.
Cross-reference heatmap observations with CSE announcements for reported block or AON (All Or None) transactions. While names of parties remain confidential, the sheer size provides confirmation that earlier visual signals captured genuine institutional interest.
Reading Level 2 Data on the CSE Trading Platform
Level 2, or market depth, displays the order book beyond the best bid and ask. On CSE-connected broker platforms such as ATrad or equivalents, users see multiple price levels with associated volumes on both buy and sell sides.
The left column typically lists bids—prices buyers are willing to pay—arranged from highest to lowest. The right column shows asks—prices sellers will accept—ordered from lowest to highest. Each row includes the number of shares or lots available at that level.
Imbalances become visible quickly. A thick stack of bids several ticks below the current price suggests latent support. Thin ask levels above may indicate easier upward movement if buying pressure persists.
Track how depth evolves over minutes. Genuine institutional interest often rebuilds bid walls after partial executions. Temporary thinning followed by replenishment at slightly higher levels can point to buyers defending or advancing their average cost.
Pay attention to the bid-ask spread. Narrow spreads in liquid names reflect healthy two-way interest. Wider spreads in lower-volume stocks amplify the importance of watching for sudden depth additions that could signal block preparation.
Combine Level 2 with the heatmap by noting when a stock's color shift aligns with order book changes. For instance, a heatmap tile turning deeper green while bid depth thickens at or above the last traded price strengthens the case for accumulation rather than short-term speculation.
Identifying Artificial Sell-Walls in the Order Book
Sell-walls appear as large clustered ask volumes at specific price thresholds. They create the impression of overhead resistance, sometimes discouraging retail buyers from pushing prices higher. On the CSE, where liquidity varies widely across counters, these walls warrant careful scrutiny.
Artificial walls often share characteristics. They materialize abruptly with sizes significantly exceeding typical daily volume. The orders may sit far from the current market price yet still influence sentiment through visible depth displays. Most tellingly, they vanish or shrink without corresponding executions when price approaches the level.
Distinguish manipulation attempts from legitimate large sell interest. Real walls from institutions preparing distribution tend to execute partially or adjust gradually as the market tests the level. Spoof-style walls disappear cleanly once they achieve the intended psychological effect of capping upside momentum.
Heatmap context helps here. A stock showing underlying green momentum despite a prominent red sell-wall in Level 2 data suggests the wall may be defensive rather than reflective of true supply. Buyers absorbing offered shares without price retreat signal confidence that the wall lacks conviction.
Monitor time and sales alongside depth. Rapid small trades hitting the ask while the wall remains intact can indicate absorption. Conversely, hesitation or price stalling near the wall level without volume support raises the chance of an artificial barrier designed to protect short positions or facilitate cheaper accumulation elsewhere.
Practical Integration: Heatmap Plus Level 2 Workflow
Effective use begins with routine. Open the TaprobaneFi CSE Heatmap at the start of the session to establish baseline sector and stock coloring. Identify names with notable relative strength or weakness compared to the broader ASPI movement.
Drill into promising candidates via your broker's Level 2 window. Note the current depth profile and set mental benchmarks for what would constitute meaningful change—such as bid volume doubling at key support or ask thinning at resistance.
Throughout the day, refresh both tools in tandem. When the heatmap shows sustained positive coloring and Level 2 reveals building bids with minimal ask pressure, the setup favors participation on the long side with tight risk parameters. The opposite combination—reddening heatmap and persistent or growing sell depth—signals caution or potential short-term exit opportunities.
For block trade anticipation, watch for multi-day patterns. Accumulation rarely completes in one session. A stock migrating from neutral to consistently green on the heatmap, supported by incrementally improving Level 2 bid quality, often precedes larger institutional prints. Retail traders can position fractionally ahead while maintaining discipline on position size given the inherent information asymmetry.
Avoid over-reliance on any single signal. False positives occur when retail momentum mimics institutional patterns or when news catalysts override technical depth. Cross-check with broader market breadth and sector peers for confirmation.
Common Pitfalls and Refinements
New users sometimes chase the brightest heatmap colors without depth confirmation, leading to entries into exhausted moves. Others dismiss thin order books in less liquid names, missing opportunities where institutions accumulate quietly precisely because visibility remains low.
Time of day matters. Early session depth can prove volatile as participants establish positions. Mid-morning to early afternoon often reveals more stable patterns as initial noise settles. Late-session surges require extra caution given potential for window-dressing or position squaring.
Volume context remains essential. Large depth numbers carry different weight in high-liquidity blue chips versus smaller counters. A 500,000-share sell-wall in a heavily traded banking stock may represent routine market making, while the same size in a mid-cap industrial name could signal meaningful supply or intent.
Practice reading transitions. Watch how walls evolve rather than taking static snapshots. Orders that rebuild after partial fills suggest conviction. Those that evaporate upon approach often served temporary tactical purposes.
Over time, users develop intuition for the interplay between visual heatmap signals and granular Level 2 dynamics. The combination narrows the gap between retail observation and institutional execution flow.
What Would Invalidate the Current Read
The edge from heatmap and Level 2 analysis weakens considerably if broader liquidity conditions shift dramatically—such as sustained foreign outflows or regulatory changes altering block trade reporting and execution protocols. Persistent low overall market volumes would also reduce the reliability of depth signals, as thin books amplify noise over genuine intent.
Ultimately, these tools illuminate probabilities rather than certainties. They equip retail participants with better questions about the forces driving price action on the Colombo Stock Exchange, fostering more measured engagement with institutional-scale flows.